
The Carbon Ledger
Performance Analysis of Freeway Interventions
This analysis emerges from design work developed in SES 5212 Field Studies: Eisenhower Freeway, where the question was what to build. Conducted as part of SCI 6502: Advanced Reverse Design and Embodied Carbon, it applies that course's parametric methodology directly to the Chicago project — shifting the question from design intent to carbon accountability: whether it should be built, and at what cost. The language of green infrastructure carries an implicit promise that building over a freeway is, by definition, an act of ecological repair. This analysis interrogates that promise. Using the Eisenhower Expressway (I-290) as its testbed, it constructs a performance framework that moves beyond the binary of "cap or no cap" — instead treating span, width, soil depth, vegetation density, and traffic volume as continuous variables, each with measurable consequences for embodied carbon, construction cost, operational energy, air quality, and carbon payback period. The result is not a single answer, but a decision surface: a tool for understanding the full environmental ledger of any freeway intervention before a single beam is cast.
The cross-section and radar update live as parameters change. At 18m deck width, the intervention crosses the cap threshold — the structural system shifts from steel-truss/glulam hybrid to post-tensioned concrete, the sky closes, and portal PM2.5 concentrations begin to spike. At 60m, the tool reaches the Klyde Warren Park scale. All values are parametric interpolations anchored to Han et al. 2025, Kim et al. 2017, Metropolitan Planning Council 2023, and Brasch 2023.
How to Read the Tool
Column 1: The Inputs
Six sliders on the left panel define the intervention. Deck Width is the most consequential — below 18m the tool models green bridges; above 18m it shifts into cap territory, and the Number of Bridges slider locks to 1. Span Length sets the crossing distance. Soil/Planter Depth controls structural load, ranging from 0.1m shallow planters to 1.5m deep park soil. Vegetation Density adjusts canopy cover, affecting both carbon payback and PM2.5 filtration. Daily Vehicle Count modulates real-world air quality outputs. Six live metric cards below the sliders — Carbon/m², Total Embodied, Build Cost, Annual OpEx, Payback, and Portal PM2.5 — update instantly and shift from green to amber to red as values cross performance thresholds.
Column 2: The Live Cross-Section
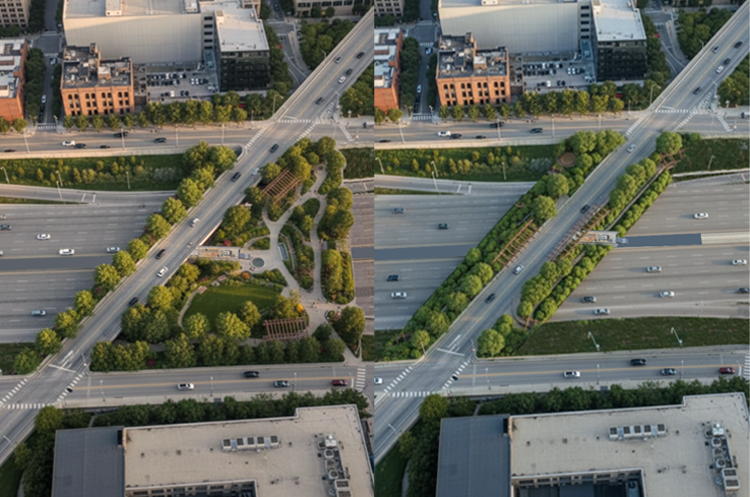
The center column functions as the tool's structural diagnosis zone. The top 55% renders a live morphing cross-section of the I-290 corridor: in green bridge mode, steel truss geometry with shallow planters flanks an open highway, with vertical dispersion arrows rising from the corridor showing natural thermal mixing; as width crosses 18m, the structure transitions to a concrete deck with retaining walls, the sky closes, and red portal arrows appear at the tunnel mouths. The bottom 45% holds the multi-criteria radar chart, scoring the current configuration against fixed green bridge and freeway cap reference benchmarks across five axes — Air Quality, Carbon Performance, Construction Speed, Connectivity, and Land Creation — so the structural form and its holistic performance profile are always visible together.
Column 3: The Charts
The right panel delivers three focused quantitative outputs. The PM2.5 dispersion chart plots how portal concentrations decay with distance from the edge, overlaid against a fixed WHO guideline of 15 µg/m³ and the green bridge and cap reference curves — making the tunnel effect's hazard radius directly legible. The embodied carbon breakdown shows the contribution of substructure, superstructure, soil/landscape, and vegetation to total carbon intensity. The carbon payback timeline plots cumulative vegetation sequestration against total embodied carbon, with a break-even marker showing the year — or, for heavy caps, the symbol ∞.
The Argument
The tool's architecture embeds a provocation: "green" is not a visual property — it is a measurable one. As deck width crosses 18 meters, the mode indicator in the masthead shifts from GREEN BRIDGE to FREEWAY CAP — and every panel moves with it. The cross-section closes over the highway. The radar shrinks on the carbon and air quality axes. The PM2.5 curve detaches from its reference and climbs toward the cap benchmark. The payback marker slides rightward until it disappears off the chart entirely and the display reads ∞. The vegetation slider reveals the final layer: even 100% canopy cover cannot bring a heavy concrete cap's payback within a human lifetime — the sequestration line never catches the emissions pulse. For Chicago's West Side communities — Little Italy, the Illinois Medical District, the neighborhoods surrounding Malcolm X College — which already carry disproportionate asthma rates and environmental health burdens, these are not abstract curves on a chart. They are a question of whose generation pays the carbon debt, and whose neighborhood breathes the concentrated plume.
Precedents as Calibration Points
Three built projects anchor the framework's extremes and midpoints, serving as real-world calibration for the modeled outputs.
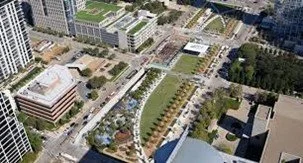
Klyde Warren Park, Dallas
Tool benchmark at 60m width, 1.0m soil. Carbon payback: >200 years. Socially transformative; climatically a century-scale carbon source.
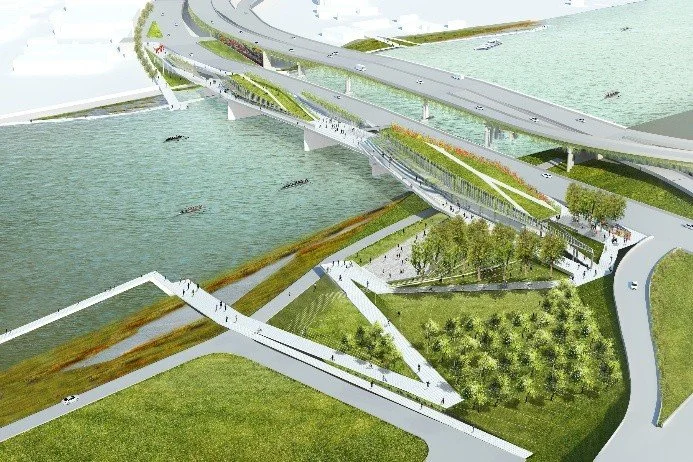
11th Street Bridge Park, D.C.
Adaptive reuse of legacy piers. Lightweight superstructure cuts payback to ~45 years — the tool's green bridge benchmark.
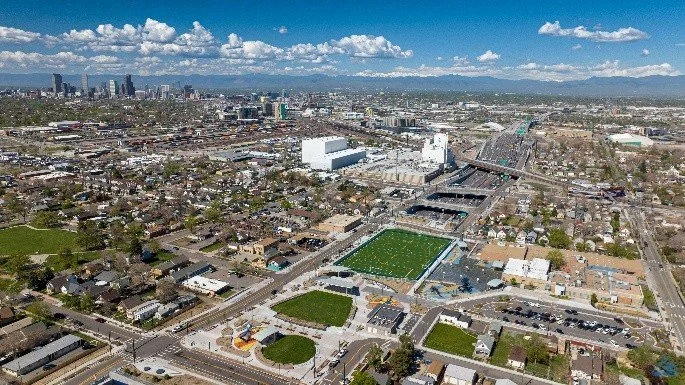
I-70 Cover Park, Denver
Real-world validation of the portal effect. Air quality monitors near tunnel mouths registered PM2.5 spikes, confirming what the dispersion chart models.
In the shift from surface greening to structural accountability, the I-290 corridor becomes a testbed for a new paradigm: infrastructure that not only looks green, but is measurably low-carbon, health-protective, and just.